
Visualizing the Evolution of Historical Networks Using Small Multiples in Grid Charts
DOI:
https://doi.org/10.25517/jhnr.v7i1.87Keywords:
Historical time, dynamic networks, small multiples, grid charts, German historyAbstract
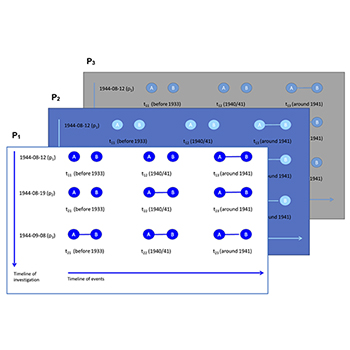
Historical time presents interesting conceptual problems for network visualization. The manifestations of time in historical network research (HNR) are similarly numerous and distinct. Time in HNR cannot always be reduced to the concept of chronological time, which is often implicit in abstract scientific models of networks, particularly since historical networks do not contain all the data about times and paths, but merely what has been documented. The complexity of historical networks exists at all levels and extends from data to visualization to interpretation. Further, historical datasets do not always contain the kind of accurate timestamps that would allow researchers to plot all time-dependent paths, nor to know which ones are missing, and time markers are rarely as accurate or detailed as those in datasets created by current technology. Thus, a model of time with variable temporal units is more generally appropriate in HNR than a regular chronometric one. Likewise, historical accounts often contain more than one agent’s perspective on the evolution of a network. In this article, we present a method for visualizing historical networks that can be used at various timescales and is responsive to various kinds of historical time. To display snapshots of a network, we propose an agent-perspective-time matrix that is flexible and puts the visual emphasis on change in the network rather than states of the network. We use small multiples placed within a grid chart to represent states of a network at a particular moment and/or from multiple perspectives. Using examples from German history, we discuss two case studies with different conceptions of time, as well as other problems that we frequently encounter in re-constructing networks. Finally, we propose a visualization technique for use in the small multiples: using color to reveal changes in the network. Whereas color is often used in HNR to represent the static characteristics of nodes, edges, or communities, it is possible to use color to emphasize the evolution of the network. When color is used to highlight the dynamic aspects of the network, nodes and edges are colored according to whether they emerge, persist, or disappear; network growth and dissolution are thus foregrounded. This method is, therefore, preferable when network dynamics are of greater research interest than the static qualities of the network, such as the properties of nodes or communities.
Downloads
Published
How to Cite
Issue
Section
License
Copyright (c) 2022 Melanie Conroy, Kimmo Elo, Malte Rehbein, Linda von Keyserlinngk-Rehbein

This work is licensed under a Creative Commons Attribution-NoDerivatives 4.0 International License.
A Creative Commons Attribution-NoDerivatives 4.0 (CC BY-ND 4.0) license applies to all contents published in JHNR. While articles published on JHNR can be copied by anyone for noncommercial purposes if proper credit is given, all materials are published under an open-access license with authors retaining full and permanent ownership of their work. For details please consult the Open Access and Copyright Notice.
